Soil Naming:
The name of a soil usually corresponds to the subgroup level.
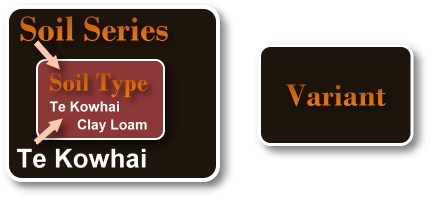
Each soil series is made up of soil types, the lowest naming level. Soil types have the narrowest ranges of characteristics, with relatively uniform morphology, chemical, physical, climatic and slope features. The soil type may be subdivided into phases.
Sometimes a soil variant is identified - this indicates that there is enough dis-similarity to justify the identification of a new series but, because of the soil's limited distribution, creation of a new series is not yet justified.
The diagram shows the interrelationships between soil names and soil series.
Soil Maps:
Producing a soil map:
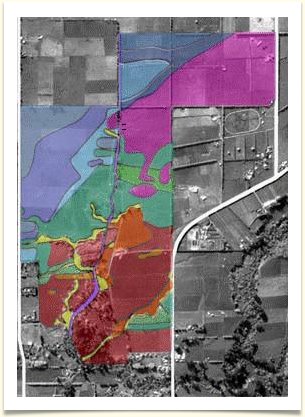
A soil survey involves gathering soil information and plotting it onto a map.
During a soil survey, areas of land dominated by a particular soil are identified by digging holes in the soil and taking soil core samples.
The areas of land occupied by a soil are plotted on a map. After this procedure has been repeated many times and cross-checking and assessments have been undertaken, a complete soil map for an area is built up.
Mapping of soils is aided by an understanding of soil/landscape relationships - low flat areas may be dominated by white, poorly drained clayey soils, slightly higher ground by well drained yellowish sandy soils.
Soil names on a Soil Map:
The boundaries of an area of land dominated by a particular soil are drawn onto a map as a map unit. Typically named only after the dominant soil occurring within it, a map unit usually contains some minor soil types as well.
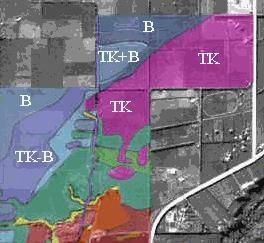
The dominant soil in a map unit is indicated by a symbol, eg TK for Te Kowhai soil type, B for Bruntwood soil type. Where different soils are intricately mixed or nearly equal in significance for a map unit, compound symbols are used:
- TK+B indicates the presence of two distinct soils (Te Kowhai and Bruntwood), the first of which is most abundant
- TK-B indicates a gradation from the most abundant soil (Te Kowhai) to another, slightly less abundant soil (Bruntwood).
Limitations of soil maps occur because soil variations can be quite distinctive over a distance of just several metres. It is possible in some areas to have several different soils within one paddock, whereas another area may have one soil covering hundreds of hectares.
If a soil map is produced at a very detailed scale, say 1:5000 (where 1 cm2 of map represents 0.25 ha), several different soils would probably be able to be shown within a single paddock. If, however, the map scale is not very detailed, such as 1:50000 (where 1 cm2 of map represents 25 ha), it is very difficult if not impossible to show all of the soils found within a local area - of necessity, the most common soil would be shown as if it were occupying the entire (25 ha) area.
Less detailed soil maps showing only the generalised soil distribution of an area are useful, however, especially to people who work at a national or regional level, because general soil maps provide:
See an example of a Soil Map, The Farm Survey
 |
a broad perspective of the soils and landscapes in an area, |
|
the opportunity to identify large areas of a particular soil type most suited to certain types of farming or other land uses, |
|
the opportunity to identify areas of soil with properties that are unfavourable for certain land uses. |
Detailed soil maps are often produced for special areas where accurate knowledge of soil distribution is required, such as for research stations or horticultural developments.
See Also: Naming the Soil section